
Made in America
Get Connected With



Alloy Steel is rarely chosen for its name alone. Buyers compare strength, toughness, heat resistance, machinability, and performance under demanding conditions. A forged shaft, a boiler component, and an automotive gear may each require a different grade and production route. Small differences in chemistry and heat treatment can matter. So can consistency between batches.
This guide examines ten major alloy steel manufacturers and the capabilities that help distinguish them. It considers product range, manufacturing scale, technical support, quality systems, and experience serving sectors such as energy, transport, construction, and machinery. These points offer a practical starting place, not a universal verdict. A producer with extensive standard stock may not be the best fit for a custom component with strict testing needs. That is worth remembering.
The companies featured operate across different markets and specialize in different products. Their strengths should be assessed against the application, required specifications, delivery region, and available technical documentation. Buyers may also want to verify current certifications and discuss traceability before placing an order. Company capabilities change, and public descriptions do not tell the whole story. The comparison is useful, but it cannot replace careful supplier checks or engineering advice.
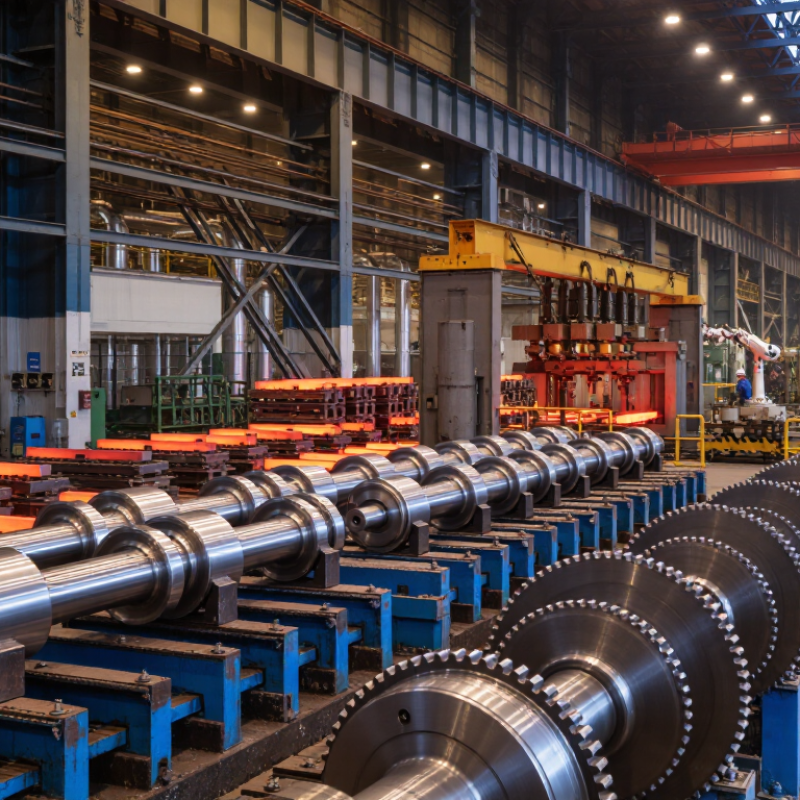
Alloy steel is steel whose properties are adjusted with carbon and other elements. Carbon increases hardness and strength, but too much can reduce toughness and make welding more difficult. The balance matters. Chromium can improve wear and corrosion resistance, while nickel often supports toughness. Molybdenum can help steel retain strength under heat. These effects depend on composition and processing, not just an element’s presence.
A grade describes a controlled range of ingredients, not a guarantee of identical performance in every part. Heat treatment, section thickness, and manufacturing conditions also shape the result. A thick shaft may cool differently from a thin test sample. That difference can affect hardness and strength. Engineers sometimes focus too heavily on tensile strength; fatigue life, impact resistance, and machinability may matter just as much. Grade selection is rarely tidy.
Tips: Check the material certificate and confirm the specified grade and heat treatment. Compare the required properties with the part’s actual service conditions. Ask how the steel will be formed, welded, or machined before choosing. A small chemistry difference can matter. So can the process.
Global steel production reached 1.892 billion tonnes of crude steel in 2023, according to industry reporting. That figure shows the scale of the market behind construction, transport, machinery, and energy infrastructure. It does not mean 1.892 billion tonnes of alloy steel were made. Crude steel includes many grades, while alloy steel is a more specific category shaped by added elements and performance requirements. That distinction matters.
At this scale, small differences in composition can affect strength, hardness, corrosion resistance, and how a component behaves under heat. Manufacturers rely on controlled melting, precise chemistry checks, and testing of finished material. A lab sample may look unremarkable, yet a slight variation in chromium or molybdenum can change its suitability for a demanding part. Production volume alone cannot show that level of control.
The global total also offers context for comparing manufacturers, but it is not a quality ranking. Large output can indicate broad capacity; it cannot, by itself, confirm consistent alloy grades, reliable delivery, or strong technical support. Buyers should examine specifications, test documentation, and the intended service conditions. Even then, comparisons are imperfect, because public data may group products differently. That deserves a closer look.
Global crude steel production reached 1,892.2 million tonnes in 2023. The chart compares the ten largest national producers; figures are in million tonnes.
These figures cover crude steel production across all steel types, not alloy steel alone. Source: World Steel Association, World Steel in Figures 2024.
A credible top-ten ranking of alloy steel manufacturers should compare verified output, product breadth, installed capacity, and quality controls—not reputation alone. World Steel Association’s World Steel in Figures 2024 reports 1,892.4 million tonnes of crude steel production in 2023. That figure gives market context, but it does not isolate alloy steel. A ranking that treats total steel output as alloy output would mislead buyers.
Output matters. So does consistency. A useful scorecard checks annual alloy-grade production, furnace and finishing capacity, and the range of grades available. Portfolio depth can include chromium, nickel, molybdenum, and tool steels, with documented chemistry and mechanical properties. Capacity figures should distinguish nameplate capability from actual production; otherwise, a large plant may look stronger than it performs. Public reports often leave this distinction unclear.
Quality standards provide another test. Buyers can examine certifications, inspection records, traceability, and compliance with relevant ISO, ASTM, or EN specifications. These measures do not guarantee every shipment will be flawless. They do show whether controls are repeatable. The model is useful, not perfect. Supplier data is not always reported consistently, and alloy categories vary between sources. Any final ranking should disclose its definitions, reporting year, and scoring weights, so readers can judge the evidence rather than accept a polished league table.
| Rank | Anonymous Maker | 2023 Crude Steel Output | Alloy and Specialty Steel Portfolio | Published Capacity | Relevant Product Standards |
|---|---|---|---|---|---|
| 1 | Maker 01 | 130.77 million tonnes | Large-scale steel group with alloy and specialty steel grades; product mix varies by mill and site. | Comparable group-wide alloy-steel capacity is not consistently disclosed. | Grade-dependent examples: ISO 683, EN 10083, ASTM A29/A29M, and JIS G4053. |
| 2 | Maker 02 | 68.52 million tonnes | Broad steel portfolio that includes alloy and other value-added grades; availability varies by production site. | Comparable group-wide alloy-steel capacity is not consistently disclosed. | Grade-dependent examples: ISO 683, EN 10083, ASTM A29/A29M, and JIS G4053. |
| 3 | Maker 03 | 55.89 million tonnes | Integrated steel production with specialty and alloy-grade products for selected industrial applications. | Comparable group-wide alloy-steel capacity is not consistently disclosed. | Grade-dependent examples: ISO 683, EN 10083, ASTM A29/A29M, and JIS G4053. |
| 4 | Maker 04 | 43.66 million tonnes | Wide range of steel products, including alloy and specialty grades; exact specifications depend on the mill and product. | Comparable group-wide alloy-steel capacity is not consistently disclosed. | Grade-dependent examples: ISO 683, EN 10083, ASTM A29/A29M, and JIS G4053. |
| 5 | Maker 05 | 41.21 million tonnes | Produces specialty and alloy steel grades alongside high-volume carbon steel products. | Comparable group-wide alloy-steel capacity is not consistently disclosed. | Grade-dependent examples: ISO 683, EN 10083, ASTM A29/A29M, and JIS G4053. |
| 6 | Maker 06 | 41.18 million tonnes | Portfolio includes alloy and higher-strength grades for industrial and engineering uses. | Comparable group-wide alloy-steel capacity is not consistently disclosed. | Grade-dependent examples: ISO 683, EN 10083, ASTM A29/A29M, and JIS G4053. |
| 7 | Maker 07 | 36.99 million tonnes | Large producer with specialty steel operations, including selected alloy grades. | Comparable group-wide alloy-steel capacity is not consistently disclosed. | Grade-dependent examples: ISO 683, EN 10083, ASTM A29/A29M, and JIS G4053. |
| 8 | Maker 08 | 35.73 million tonnes | Portfolio includes specialty and alloy steel products as well as other high-value steel grades. | Comparable group-wide alloy-steel capacity is not consistently disclosed. | Grade-dependent examples: ISO 683, EN 10083, ASTM A29/A29M, and JIS G4053. |
| 9 | Maker 09 | 33.82 million tonnes | Produces specialty grades, including selected alloy steels, with product availability varying by facility. | Comparable group-wide alloy-steel capacity is not consistently disclosed. | Grade-dependent examples: ISO 683, EN 10083, ASTM A29/A29M, and JIS G4053. |
| 10 | Maker 10 | 29.50 million tonnes | Broad steel portfolio that includes alloy and specialty products for engineering and manufacturing applications. | Comparable group-wide alloy-steel capacity is not consistently disclosed. | Grade-dependent examples: ISO 683, EN 10083, ASTM A29/A29M, and JIS G4053. |
Method note: Rankings and output figures are based on reported 2023 crude steel production and are not measurements of alloy steel output. Public data do not provide a consistent, comparable alloy-steel capacity figure for all producers. The listed standards are examples used to specify steel grades; they do not claim that every maker or facility holds a particular certification.
Comparing ten leading alloy-steel manufacturers requires more than counting tonnes. Large integrated producers may make several million tonnes of steel annually, but only part of that output is alloy steel. Specialist mills often produce far less, with tighter control over chemistry and heat treatment. Scale matters.
Common grades include chromium-molybdenum steels for pressure equipment, nickel-chromium-molybdenum grades for demanding machinery, and tool steels for cutting and forming. High-strength low-alloy steels also serve construction, transport, and energy markets. Buyers should check the exact grade, delivery condition, and inspection documents; similar names do not guarantee identical performance.
Production scale varies by product and reporting method. Some figures combine stainless, carbon, and alloy steel, making direct comparisons unreliable. A useful market review separates crude-steel capacity from finished alloy-steel output and notes whether a mill supplies bar, plate, wire, or forgings. These distinctions can change the apparent ranking. The data is imperfect, and rankings can look tidier than the underlying records. For engineers, consistent specifications and traceable test results often matter more than a producer’s headline capacity.
A useful comparison of alloy steel manufacturers starts with traceability, not catalogue breadth. ISO 9001 supports quality management, while IATF 16949 is relevant to automotive supply chains. Neither certificate proves that a specific heat meets a buyer’s fatigue, cleanliness, or dimensional requirements. Not a guarantee. Buyers should check test certificates, chemistry tolerances, heat-treatment records, and whether audits cover the actual production site.
End uses reveal different strengths. Automotive gears and axles need consistent hardenability; pressure vessels require dependable toughness and inspection records. Wind turbine shafts and mining components face heavy cyclic loads, so fatigue performance matters. The International Energy Agency’s Iron and Steel Technology Roadmap estimates that steelmaking accounts for about 7% of global energy-system emissions. That makes energy efficiency and emissions reporting increasingly relevant, though published figures may not separate alloy steel from other grades.
Regional scale offers context, not a ranking. The World Steel Association reported 2024 crude-steel output of 1,882.6 million tonnes; China produced 1,005.1 million tonnes and India 149.6 million. East Asia therefore has immense production capacity, while European and North American suppliers often serve demanding industrial and transport specifications. The comparison is imperfect: public production statistics rarely isolate alloy grades, and certification scope varies. A careful shortlist should compare grade range, delivery consistency, regional service, and independently verified plant-level documentation.