
Made in America
Get Connected With



Choosing the best Vaping Sensors from China takes more than comparing prices or product photos. A useful sensor should detect vaping-related airborne changes reliably, provide clear alerts, and fit the space where it will be installed. A school corridor, hotel room, and office restroom each present different airflow and maintenance conditions. Small details matter.
Buyers should examine the detection method, response time, monitoring range, connectivity, and alert options. Ask suppliers for technical specifications, test procedures, and documentation supporting their performance claims. Where available, independent test results offer useful context. A polished dashboard is not proof of accurate detection. Nor is a low price proof of poor quality. Look closely.
Installation and upkeep deserve equal attention. Dust, ventilation, cleaning products, and device placement may affect readings or trigger unwanted alerts. Ask how the sensor is calibrated, whether updates are available, and what happens when Wi-Fi fails. These practical questions are easy to miss during a quick supplier comparison.
This guide explores how to assess Chinese manufacturers, compare product features, and verify support before making a purchase. It also considers integration, data handling, and the limits of sensor readings. No device is perfect; performance can vary by setting. That caveat matters. A careful comparison, backed by documentation and a realistic site trial, can help buyers choose a system suited to their needs rather than relying on marketing language alone.
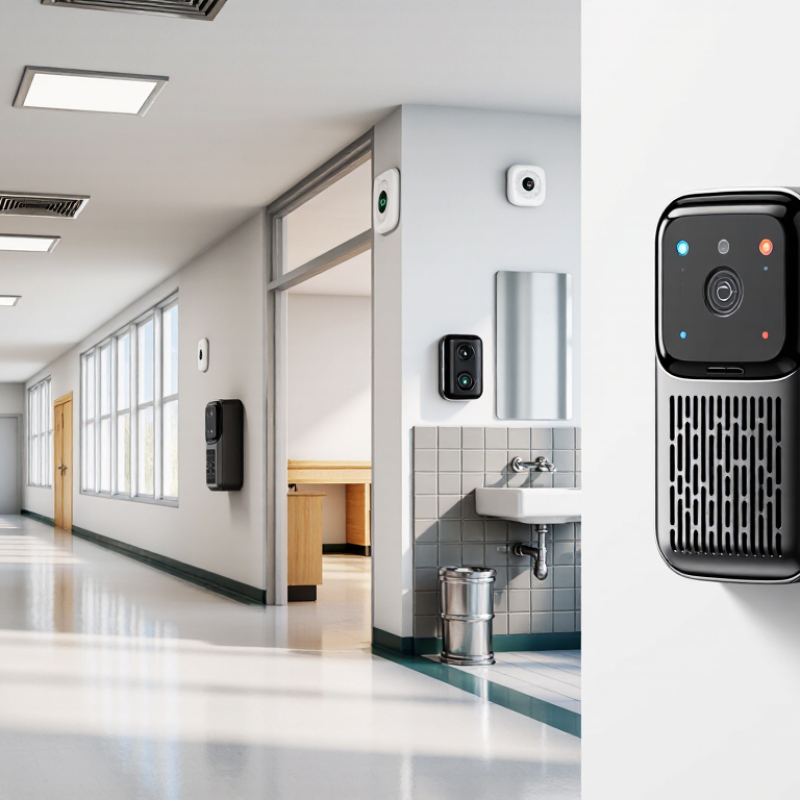
Chinese vape sensors generally use three detection approaches: particulate matter (PM), volatile organic compounds (VOCs), or a combination. PM sensors use light scattering to estimate airborne particle levels. They can show a rapid rise near a room’s ventilation outlet, but dust, cooking aerosols, and humidity may also trigger readings. In a controlled study, Schober and colleagues reported indoor PM2.5 rising from about 6–18 to 85–100 µg/m³ during e-cigarette use. The study was small, so those figures are not universal thresholds.
VOC sensors respond to changing gas mixtures, including some compounds found in indoor air. They usually cannot identify a specific substance, and cleaning products or fragrances can cause similar signals. The National Academies’ 2018 report found that e-cigarette aerosol can contain VOCs and fine particles, supporting the use of more than one measurement channel. Still, a VOC reading alone does not prove a particular source. Not perfect.
Multi-sensor devices combine PM and VOC readings, sometimes with humidity and temperature data. This can help distinguish a brief particle spike from a broader air-quality change, especially in a classroom or shared office. Look for documented calibration, clear response-time specifications, and testing under realistic airflow conditions. EPA guidance on air sensors stresses that many lower-cost devices are best used for information, not as regulatory instruments. A small weakness remains: sensor placement and ventilation can change readings more than expected. That matters.
When assessing a vaping sensor from China, start with what it actually measures: estimated PM₂.₅, not a complete chemical analysis. WHO’s air-quality guideline is 5 µg/m³ as an annual mean and 15 µg/m³ over 24 hours. These are ambient-air health benchmarks, not vaping-specific pass-or-fail limits. Keep that distinction visible.
A practical unit should log readings, show units, and respond consistently at a fixed height and distance. Test it in a quiet room, then during a brief, controlled aerosol event, recording window and ventilation conditions. Wait for readings to settle. Many low-cost optical sensors estimate particles and may mistake humidity or droplets for fine particulate matter. Useful, but imperfect. Compare repeated trials rather than trusting one dramatic spike.
For a meaningful comparison, review 24-hour averages and longer-term trends against WHO values, while noting outdoor pollution and cooking. A single minute above 15 µg/m³ is not a 24-hour exceedance. Nor does a low reading prove exposure is absent. I would look for calibration details, uncertainty ranges, and clear data export before relying on any device. Real rooms are messy.
When comparing vaping sensors from China, start with particle coverage. Optical sensors estimate airborne particle concentration, but their size range and reporting units can differ. Check whether a model reports PM2.5, particle counts, or both. These readings can show changes near a doorway or desk. They cannot identify the source on their own. That distinction matters.
VOC coverage adds another layer. Many sensors provide a broad VOC index rather than a precise reading for a particular compound. Ask whether the device reports an index or calibrated concentration, and review its stated detection range. Humidity and temperature can shift readings. A sensor that responds quickly may still produce misleading results. Fast is not always better.
Compare response time under similar test conditions, including airflow and sensor placement. Some specifications describe the time needed to reach 90 percent of a test reading; confirm how that figure was measured. Accuracy claims are more useful when supported by calibration details and comparison with a reference instrument. Check repeatability across several readings, not just one. Field conditions are messy. I would also look for clear guidance on maintenance and sensor replacement, since aging components can drift. No single metric tells the whole story.
| Sensor Configuration | Particle Coverage | VOC Coverage | Typical Response Time | Typical Accuracy and Limitations | Best Suited For |
|---|---|---|---|---|---|
| Compact optical particle sensor | Usually estimates PM1.0, PM2.5, and PM10 from light scattering; some versions also report particle counts. | None unless paired with a separate gas sensor. | About 1–10 seconds for a changing particle signal; readings may be averaged over a longer interval. | Often roughly ±10–25% against a suitable reference under controlled conditions. Results can shift with aerosol size, composition, humidity, and airflow; it does not identify vaping specifically. | Low-cost indoor trend monitoring and detecting short-lived aerosol events. |
| Optical particle sensor plus MOS VOC sensor | Typically PM1.0, PM2.5, and PM10 estimates. | Broad response to some volatile compounds; commonly reported as a TVOC estimate or relative VOC index, not as a vape-specific measurement. | Particles: about 1–10 seconds. VOC: commonly tens of seconds to several minutes, depending on sensor and airflow. | Particle performance has the limitations listed above. MOS VOC readings are affected by humidity, temperature, and other gases; many low-cost units are not accurate enough to quantify individual VOCs in ppm. | General indoor air-quality monitoring where a combined particle and broad VOC trend is useful. |
| Optical particle sensor plus PID VOC detector | PM estimates depend on the selected optical particle module. | A photoionization detector responds to many ionizable VOCs; coverage depends on lamp energy and the compounds present. | Often a few seconds to tens of seconds, depending on the PID, sampling system, and data filtering. | Can provide more useful VOC concentration measurements than a basic MOS sensor when calibrated with an appropriate reference gas. Response factors vary by compound, and a PID does not detect every VOC or identify a vaping source. | Applications needing faster, more quantitative VOC screening and a separate particle measurement. |
| Optical particle counter with calibrated gas-sensing module | May report particle-size bins or counts as well as PM estimates; capabilities vary by instrument. | Depends on the gas module fitted, such as MOS or PID; the module determines whether results are an index or a calibrated concentration. | Typically seconds for particles; gas response ranges from seconds to minutes. | Particle sizing and concentration require suitable calibration and correct sampling. Gas accuracy cannot be inferred from the particle counter and must be checked for the specific gas module. | Installations that need particle-size information alongside a separately specified gas measurement. |
| Reference-grade aerosol and gas instrument combination | Can measure aerosol mass or particle size using methods selected for the monitoring objective. | Can use analytical or calibrated gas-specific methods, depending on the target compounds. | Method-dependent: seconds for some particle instruments; minutes or longer for many compound-specific analyses. | Generally offers stronger traceability when operated and calibrated to its method, but accuracy, detection limits, and response time are instrument- and method-specific. Higher cost and maintenance are typical. | Validation studies, compliance-oriented work, and checking lower-cost sensor performance. |
How to interpret this comparison: These are indicative technology-class characteristics, not verified specifications for a particular product or supplier. Vaping aerosols vary, and low-cost particle and VOC sensors cannot by themselves confirm that an event came from vaping. Confirm the exact measurement range, calibration method, response-time definition, and test conditions before selecting a unit.
Check GB/T 18883-2022: The 8-Hour TVOC Limit Is 0.6 mg/m³
A reliable vaping sensor should show more than a changing number on a screen. Check its calibration records, data logging, humidity compensation, and response time. GB/T 18883-2022 sets an eight-hour average limit of 0.6 mg/m³ for total volatile organic compounds (TVOC). This is an indoor-air benchmark, not a vaping-specific alarm threshold. TVOC sensors respond to a range of compounds, so a high reading cannot identify its source by itself.
The National Academies’ 2018 report, Public Health Consequences of E-Cigarettes, describes secondhand aerosol containing particulate matter and nicotine. That evidence supports monitoring more than TVOC alone where practical. Look for instruments that can track fine particles alongside VOCs, and compare readings with ventilation, occupancy, and background conditions. A tidy dashboard can still mislead. I would want to see field calibration data, not just a laboratory graph.
Tips: Place the monitor near breathing height, away from windows and direct airflow. Record a clean-air baseline before testing. Treat one spike as a clue, not proof.
The best sensor depends on where it will be installed and how staff will use its alerts. A small classroom, corridor, and shared restroom have different airflow, occupancy, and maintenance needs. Check the recommended coverage area, mounting height, power options, and network requirements before comparing prices. A device placed near a vent may miss changes in another part of the room. Placement matters.
Ask what an alert looks like in practice. Can it reach a designated staff member, show the sensor location, and record the time? Useful data logs can help teams spot recurring patterns, but they should be reviewed alongside site conditions. Dust, cleaning products, humidity, and poor ventilation may affect readings. Detection is an indicator, not proof of a specific activity or person. No sensor is perfect, and I would treat unexplained readings as a reason to check conditions, not to jump to conclusions.
Tips: Request clear guidance on calibration, testing, software updates, and data retention. Compare sample logs, not just feature lists. Confirm who can access alerts and how long records remain available. If readings seem inconsistent, check placement and airflow before relying on them. A simple site trial can reveal problems a brochure cannot.